

For any team running on Maven, the SonarQube Maven plugin is the most direct way to embed continuous code analysis into your build lifecycle. It lets you run mvn sonar:sonar to find bugs, vulnerabilities, and code smells without needing a separate scanner installation or complex CI/CD scripts. It is, quite simply, the native way to connect a Java project to your SonarQube server.
Integrating SonarQube Analysis Into Your Maven Build
Adding another tool to a development process can introduce friction, but the SonarQube Maven plugin is designed to do the opposite. It turns what could be a separate, out-of-band activity into a natural part of your existing build process.
This seamless integration is what makes it so effective. Instead of analysis being a task someone remembers to run occasionally, it becomes an automated check that happens right where developers work—the command line and the CI/CD pipeline. This helps teams catch and fix issues much earlier, when the cost of remediation is lowest. For example, a developer can run mvn verify sonar:sonar locally before pushing code to see if they’ve introduced a new “blocker” issue, allowing them to fix it immediately.
More Than Just a Scanner
One of the primary benefits of using the SonarQube Maven plugin is that it helps you manage technical debt. It translates abstract quality problems like code smells and poor maintainability into concrete, measurable metrics that you can track over time. Visualising this data in SonarQube allows teams to make informed decisions about where to focus refactoring efforts.
The real value emerges when code analysis stops being a reactive report and becomes a proactive quality gate. This shift is essential for meeting modern security and compliance standards.
With regulations like the EU’s Cyber Resilience Act (CRA) coming into force, demonstrating due diligence in your development practices is becoming a legal requirement. Using tools like the SonarQube plugin provides tangible evidence of your commitment to code quality and security. This is closely related to dependency management, which you can read more about in our guide to using the mvn dependency:tree command: https://goregulus.com/cra-basics/mvn-dependency-tree/
The plugin itself has evolved significantly. The current stable version, 5.2.0.4988, was released on August 29, 2025. It requires Java 21 for optimal performance but maintains backward compatibility for projects running on Java 11. You can find the complete official documentation for the SonarScanner for Maven on the SonarSource website.
Running Your First Analysis Like a Pro

Getting your first analysis running with the SonarQube Maven plugin is surprisingly straightforward. Once you have a SonarQube server instance up and a Maven project ready to go, the real work is just a few quick configuration steps.
The beauty of this approach is that the entire configuration lives inside your pom.xml. This keeps your analysis setup version-controlled and consistent for everyone on the team, effectively eliminating the classic “it works on my machine” headache.
Configuring Your pom.xml
Your first step is to let Maven know about the SonarQube plugin and, crucially, where to send the analysis results. This involves adding a <plugin> definition inside your <build> section and setting a few key properties.
Here’s a practical, annotated pom.xml snippet that you can adapt for your own project.
<project>
    ...
    <!-- 1. Define SonarQube properties for all modules -->
    <properties>
        <project.build.sourceEncoding>UTF-8</project.build.sourceEncoding>
        <maven.compiler.source>17</maven.compiler.source>
        <maven.compiler.target>17</maven.compiler.target>

        <!-- URL of your SonarQube server -->
        <sonar.host.url>https://sonarqube.your-company.com</sonar.host.url>

        <!-- The token is best passed via command line for security -->
        <!-- <sonar.login>your_generated_token</sonar.login> -->
    </properties>

    <build>
        <pluginManagement>
            <plugins>
                <!-- 2. Add the SonarQube Maven plugin -->
                <plugin>
                    <groupId>org.sonarsource.scanner.maven</groupId>
                    <artifactId>sonar-maven-plugin</artifactId>
                    <version>3.11.0.3922</version> <!-- Use the latest compatible version -->
                </plugin>
            </plugins>
        </pluginManagement>
    </build>
    ...
</project>
Let’s break that down. The <properties> section is where you define global settings for your build. The most important one here is sonar.host.url, which tells the plugin where your SonarQube server lives.
The <plugin> block, nested inside <pluginManagement>, registers the sonar-maven-plugin itself, making its goals available to your build process.
We’ve intentionally commented out
<sonar.login>. While you can hardcode your authentication token here, it’s a significant security risk. A much safer practice is to pass the token via the command line or, even better, use secrets management in your CI/CD pipeline.
Understanding Key Properties
While sonar.host.url is essential, a few other properties are fundamental for getting a meaningful analysis. These tell SonarQube what your project is and how to interpret the code.
Here are the key properties you’ll need to configure your first analysis, along with their purpose and a practical example.
Essential SonarQube Maven Plugin Properties
| Property | Description | Example Value |
|---|---|---|
sonar.projectKey |
The unique identifier for your project in SonarQube. It must be unique across your instance. | com.my-company:my-awesome-app |
sonar.projectName |
The display name for your project that appears in the SonarQube UI. | My Awesome Application |
sonar.projectVersion |
The version of the project being analysed. Often tied to your project's release version. | 1.2.0-SNAPSHOT |
sonar.login |
The authentication token used to connect to the SonarQube server. Best practice is to pass this via the command line or CI secrets. | sqp_a1b2c3d4e5f6... |
These properties are typically defined in the <properties> section of your pom.xml or passed as -D arguments during the Maven execution. For example, you could add <sonar.projectKey>com.my-company:my-awesome-app</sonar.projectKey> directly into your POM’s <properties> block.
Executing the Analysis
With the pom.xml configured, you’re ready to run the scan. First, you’ll need to generate an authentication token from your SonarQube server. Just navigate to My Account > Security in the UI and generate a new token, giving it a descriptive name.
Now, open a terminal in the root directory of your Maven project and run this command:
mvn clean verify sonar:sonar -Dsonar.login=YOUR_SONAR_TOKEN
The clean verify goals are important; they ensure you are analysing the most recent, compiled version of your code with up-to-date test results. The sonar:sonar goal is the main event—it collects all the project data, metrics, and test coverage reports, then sends everything to the server you defined in sonar.host.url.
By using -Dsonar.login, you pass your token securely for this one execution without committing it to your source code repository. As you mature your processes, you’ll find that understanding the role of static code analysis is critical for building a robust, compliant development lifecycle.
Once the command finishes, you’ll see a summary in your console, including a direct link to the project dashboard in SonarQube. Click that link, and you’ll find your first complete report, ready with identified bugs, vulnerabilities, and code smells. You’ve now established a repeatable foundation for continuous code quality.
Tackling Advanced Configuration for Complex Projects

While a basic setup gets you up and running, real-world enterprise applications call for more sophisticated configurations. Large projects are rarely single-module monoliths; they are often complex multi-module Maven projects where a parent pom.xml orchestrates dozens of child modules like api-service, data-model, and batch-processor.
Fortunately, the SonarQube Maven plugin handles this scenario beautifully. When you run mvn sonar:sonar from the root of a multi-module project, the plugin automatically aggregates the analysis results from all child modules into a single, cohesive report in SonarQube. This gives you a unified view of your entire application’s health, from the core business logic right down to the utility classes.
Mastering Multi-Module Analysis
For a multi-module project, the best practice is to define the sonar-maven-plugin and key properties like sonar.host.url in the parent pom.xml. This configuration is then inherited by all child modules, which ensures consistency and saves you from repeating yourself. The plugin is smart enough to identify the project structure, scan each module individually, and then merge the findings.
The real power here is the aggregation. You can see overall code coverage, duplication, and security ratings for the entire application, while also being able to drill down into the specific issues plaguing a single module. This is vital for managing large codebases.
Dynamic Analysis for Branches and Pull Requests
Modern development workflows are built around branches and pull requests (PRs). SonarQube really shines here by providing feedback directly within these workflows, and the Maven plugin makes enabling this a straightforward task. By passing a few specific properties, you can trigger a “preview” analysis that decorates your PR in GitHub, GitLab, or Azure DevOps.
sonar.pullrequest.key: The unique ID of the pull request (e.g.,123).sonar.pullrequest.branch: The name of the feature branch being merged.sonar.pullrequest.base: The name of the target branch (e.g.,mainordevelop).
Your CI/CD pipeline script would dynamically populate these properties when a pull request is created. For example, a GitHub Actions workflow might use something like this:
mvn verify sonar:sonar
  -Dsonar.pullrequest.key=${{ github.event.pull_request.number }}
  -Dsonar.pullrequest.branch=${{ github.head_ref }}
  -Dsonar.pullrequest.base=${{ github.base_ref }}
This command tells SonarQube to analyse only the new code in the PR. The result is fast, targeted feedback right where your developers need it most.
Flexible Scans with Maven Profiles
You don’t always need the same level of analysis. A developer running a quick local check doesn’t need the same depth as a full CI build that runs before a release. This is a perfect use case for Maven Profiles, which let you define different configurations that can be activated on demand.
For instance, you could create two profiles in your parent pom.xml: one for a fast local scan and another for a comprehensive CI scan.
<profiles>
    <profile>
        <id>local-scan</id>
        <properties>
            <!-- Only run a preview analysis, don't update the main branch dashboard -->
            <sonar.analysis.mode>preview</sonar.analysis.mode>
            <sonar.sources>src/main/java</sonar.sources> <!-- Only scan main source -->
        </properties>
    </profile>
    <profile>
        <id>ci-scan</id>
        <properties>
            <sonar.projectVersion>${project.version}</sonar.projectVersion>
            <!-- Tell SonarQube where to find the JaCoCo test coverage report -->
            <sonar.coverage.jacoco.xmlReportPaths>${project.build.directory}/site/jacoco/jacoco.xml</sonar.coverage.jacoco.xmlReportPaths>
        </properties>
    </profile>
</profiles>
A developer can then run a quick local check with mvn sonar:sonar -P local-scan, while the CI server runs the full analysis using mvn sonar:sonar -P ci-scan. This flexibility improves developer productivity without sacrificing your quality gates. For those working with complex dependencies, our guide on the Maven dependency check plugin offers further strategies for securing your software supply chain.
The widespread adoption of SonarQube, now used by over 400,000 organisations globally, underscores its importance. In the European market, where CRA compliance is a major driver, the platform’s role is even more critical. Sonar serves over 14,000 customers who collectively manage nearly 300,000 organisations. The sonar-maven-plugin is a key reason for this success, as it simplifies integration and makes robust code analysis accessible. You can read more about SonarQube’s impressive adoption statistics in the Sonar community forums.
Automating Code Quality in Your CI/CD Pipeline
Running a manual analysis is a good first step, but the real value of the SonarQube Maven plugin comes from automation. When you integrate mvn sonar:sonar into your Continuous Integration/Continuous Deployment (CI/CD) pipeline, you turn SonarQube from a simple reporting tool into an active gatekeeper for your code quality.
This setup ensures every commit gets scrutinised automatically. You get immediate feedback, which is the key to preventing poor-quality code from ever making its way into your main branch. For any team that’s serious about continuous quality, this isn’t just a nice-to-have; it’s a foundational practice.
Weaving SonarQube into GitHub Actions
If your team uses GitHub, integrating a SonarQube analysis with GitHub Actions is surprisingly straightforward. You just need to create a workflow file that triggers on every push or pull request, runs your Maven build, and then kicks off the SonarQube scan.
The most critical part here is managing your SONAR_TOKEN securely. Never, ever hardcode it directly in your workflow file. The right way to handle this is to store it as an encrypted secret in your GitHub repository’s settings.
Here’s a practical example of a GitHub Actions workflow (.github/workflows/build.yml) you can adapt for your own Maven project:
name: Build and Analyse
on:
  push:
    branches: [ main ]
  pull_request:
    branches: [ main ]

jobs:
  build:
    runs-on: ubuntu-latest
    steps:
    - uses: actions/checkout@v4
      with:
        # Required for SonarQube to analyse pull requests
        fetch-depth: 0
    - name: Set up JDK 17
      uses: actions/setup-java@v4
      with:
        java-version: '17'
        distribution: 'temurin'
    - name: Cache SonarQube packages
      uses: actions/cache@v4
      with:
        path: ~/.sonar/cache
        key: ${{ runner.os }}-sonar
        restore-keys: ${{ runner.os }}-sonar
    - name: Build and analyse with Maven
      env:
        # Use the secret token configured in repository settings
        SONAR_TOKEN: ${{ secrets.SONAR_TOKEN }}
        SONAR_HOST_URL: ${{ secrets.SONAR_HOST_URL }}
      run: mvn -B verify sonar:sonar
Configuring a Jenkins Pipeline
For many organisations, Jenkins is still the workhorse for CI/CD automation, and adding a SonarQube analysis is a very common task. By using a Jenkinsfile, you can adopt a “pipeline-as-code” approach, which keeps your entire build definition version-controlled right alongside your application.
Just like with GitHub Actions, you must store your SONAR_TOKEN in the Jenkins credentials manager instead of plaintext in your script.
By making the SonarQube analysis a mandatory step in your pipeline, you create a powerful Quality Gate. If new code fails to meet your predefined standards—like dropping below 80% test coverage—the pipeline fails. This blocks the merge or deployment entirely, protecting your codebase.
This Jenkinsfile provides a great starting point for a declarative pipeline:
pipeline {
    agent any
    tools {
        maven 'Maven 3.9.6' // Assumes Maven is configured in Jenkins global tools
    }
    stages {
        stage('Build and Test') {
            steps {
                sh 'mvn -B clean verify'
            }
        }
        stage('SonarQube Analysis') {
            steps {
                // Use Jenkins credentials manager for the token
                withCredentials([string(credentialsId: 'sonarqube-token', variable: 'SONAR_TOKEN')]) {
                    sh 'mvn sonar:sonar -Dsonar.login=$SONAR_TOKEN'
                }
            }
        }
    }
}
This kind of setup actively enforces your quality standards on every single build. As you automate code quality with the SonarQube Maven Plugin, it’s also a good idea to think about the broader strategy. For a deeper look at comprehensive automation, it’s worth reading up on best practices for integrating testing into your CI/CD pipeline.
Furthermore, a well-structured CI/CD strategy is fundamental for meeting new compliance standards like the Cyber Resilience Act. You can learn more about how this fits together in our guide on Git and CI/CD basics for the CRA.
Troubleshooting Common Plugin Errors and Headaches
Even the most well-oiled machine can hit a snag, and the SonarQube Maven plugin is no exception. When a build fails right in the middle of an analysis, it can bring your entire CI/CD workflow to a screeching halt. Let’s walk through some of the most common issues I’ve seen in the wild and, more importantly, how to get them sorted quickly.
One of the first culprits to check is always authentication. If your build log spits out a 401 Unauthorized error, the problem is almost certainly your SONAR_TOKEN. This usually means the token is wrong, has expired, or the user account it’s tied to lacks the necessary permissions to execute an analysis. Before you start digging deeper, always double-check that the token stored in your CI/CD environment secrets matches a valid one from the SonarQube UI.
Navigating Version Mismatches and Memory Errors
Another frequent tripwire is version incompatibility. If your team just upgraded the SonarQube server but the sonar-maven-plugin version in your pom.xml is lagging behind, you’re asking for trouble. This mismatch often results in cryptic errors like Unsupported major.minor version that don’t immediately point to the root cause. The plugin and server must be compatible.
A good rule of thumb is to always check the official SonarQube documentation for the required plugin version whenever you upgrade your server instance. This small check can save you hours of debugging.
Memory issues are another classic, especially on larger, more complex projects. If your build fails with an OutOfMemoryError: Java heap space message during the sonar:sonar goal, it’s a clear sign that Maven doesn’t have enough memory to complete the analysis.
The fix is usually straightforward—just give Maven more memory by setting an environment variable before you run the build:
export MAVEN_OPTS="-Xmx2048m"
This command allocates a healthy 2 GB of heap space to the Maven process. While this is often enough, you might need to adjust the value depending on your project’s size and the resources available on your build agent.
The Case of the Disappearing Frontend Code
Sometimes, the problem isn’t in your local configuration but on the SonarQube server itself, leading to some truly confusing behaviour. A notable issue surfaced in late 2025 after the server update to version 2025.5. Teams with multi-module projects—combining a Java backend with an Angular or TypeScript frontend—suddenly saw their Lines of Code (LoC) metrics plummet.
The reason? Frontend files were simply no longer being analysed. Fixing this particular bug required administrators to set analysis properties directly in the SonarQube web UI, a frustrating departure from the standard infrastructure-as-code approach where all configuration lives in the pom.xml. You can read the full story on the SonarSource community forums.
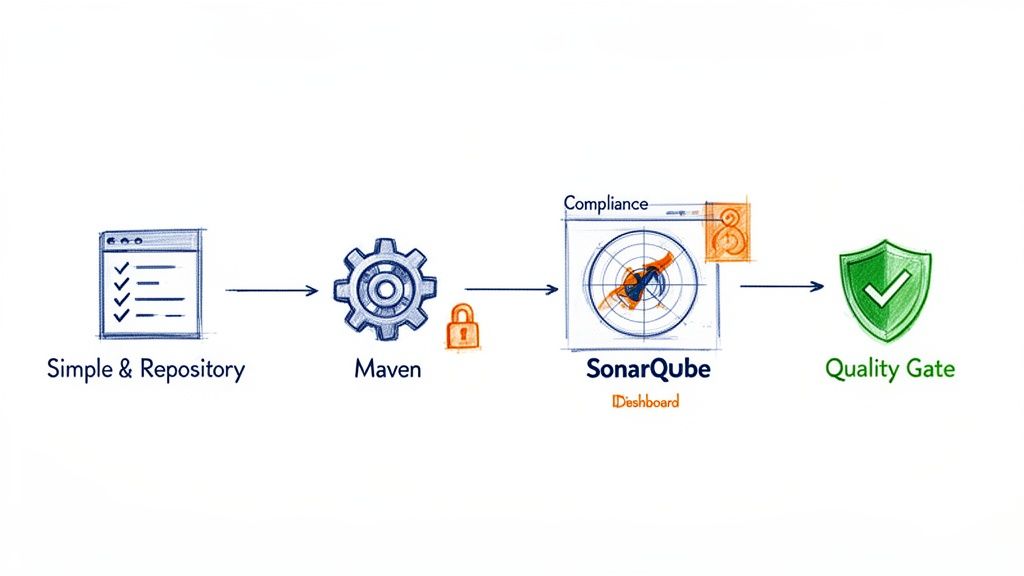
Ideally, the analysis should fit seamlessly into your pipeline, providing a continuous feedback loop.

When an unexpected error breaks this chain, it undermines the whole point of continuous quality. That’s why being able to troubleshoot these issues effectively is such a critical skill.
As you start weaving the SonarQube Maven plugin into your Maven projects, a few common questions always seem to surface. Instead of sending you digging through forums, this section answers the most frequent queries we hear from developers.
How Do I Analyse a Specific Module in a Multi-Module Project?
This is a massive time-saver, especially in large, complex applications. If you want to analyse a single module instead of triggering a scan for the entire project, just navigate into that specific module’s directory.
From there, you’ll run your standard Maven command but with two crucial flags: -pl (for project list) and -am (to also make dependencies).
For instance, to analyse only the my-api-module and ensure any modules it depends on are built first, your command would look like this:
mvn sonar:sonar -pl my-api-module -am
This approach is much faster than a full project analysis and is perfect for getting quick feedback on the code you’re actively changing.
Can I Use the SonarQube Maven Plugin Without a SonarQube Server?
No, the plugin is fundamentally designed to work with a running SonarQube server instance or a SonarCloud account. Think of the sonar-maven-plugin as a scanner or a collector. Its entire job is to gather data from your build—code metrics, test coverage, vulnerability findings—and package it up.
It then sends that information over to the SonarQube server. The server is the real “brain” of the operation. It’s where the actual code analysis happens, where quality rules are applied, where the history of your project’s quality is stored, and where the interactive dashboard is generated. The plugin simply can’t function without its server counterpart.
What Is the Difference Between sonar:sonar and sonar:scan?
This is a frequent point of confusion, but the answer is straightforward for most people. For virtually all standard Maven projects, mvn sonar:sonar is the goal you should be using. It’s the long-standing, idiomatic command for running a SonarQube analysis in the Maven ecosystem.
The sonar:scan goal was introduced more recently. The intent was to standardise the command across all the different SonarScanners (for Gradle, .NET, and others). While sonar:scan might technically work, sonar:sonar remains the officially documented and recommended command for Maven users. Stick with it.
How Do I Exclude Files or Modules From an Analysis?
Excluding code is a common and necessary task. You often need to ignore things like auto-generated sources, simple DTOs, or third-party libraries that you don’t maintain. You have two main ways to do this, both configured right in your pom.xml.
To exclude specific files or entire directories, you’ll use the
<sonar.exclusions>property. This property takes a comma-separated list of path-matching patterns.
Here’s what a practical example looks like in your properties block:
<properties>
  <sonar.exclusions>
    **/generated-sources/**,
    **/*DTO.java,
    **/config/**
  </sonar.exclusions>
</properties>
If you need to skip an entire module within a larger multi-module project, the process is even simpler. Just go to that specific module’s pom.xml and set the <sonar.skip> property to true.
<properties>
  <sonar.skip>true</sonar.skip>
</properties>
This tells SonarQube to completely ignore the module during the analysis. It’s the perfect solution for utility modules, prototypes, or other code you don’t need to track for quality metrics.
Understanding your compliance obligations under regulations like the EU’s Cyber Resilience Act is the first step toward building secure, marketable products. Regulus provides a clear, actionable roadmap to navigate the CRA, from assessing applicability to generating the required technical documentation. Gain clarity and confidence in your compliance strategy by visiting https://goregulus.com.


